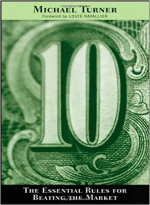
10 by Michael Turner
Preface Introduction Rule 1 Think like a Fundamentalist Rule 2 Spend Your Money Wisely—The Value Rule Rule 3 Trade like a Technician Rule 4 The Stop Loss Rule Rule 5 Never Marry a Stock Rule 6 Follow Only "Some" Insider-Trading Rule 7 Watch the Institutional Ownership Rule 8 Stay Diversified Rule 9 Balance Your Risk through Smart Asset Allocation Rule 10 Make a Lot More Money by Timing the Market Epilogue Making the Commitment to Being a Rules-Based Investor Appendices A and B
Preface
Michael Turner started his professional life as a civil engineer, but his first love was computer programming. After working a number of engineering jobs, he created a software company which he sold in 1997. Turner gave the money from the sale to a prominent investment company to manage. Even though stocks were in a bull market, his account kept shrinking month by month. After two years, Turner's account was down 45 percent and he decided he couldn't do any worse if he invested on his own.
For three years he studied both fundamental and technical analysis. Using his computer programming ability, Turner wrote a program to trade the stock market. The program proved so successful he started managing other people's money. This book is the product of what Michael Turner has tested to achieve stock market investing success.
Introduction
This book offers 10 rules for a stock investing plan. The rules are an alternative to investing with the clueless crowd who have no plan and operate on emotion.
Why Investors Lose
It's easy to make a mistake. It's hard to admit it. This reality is why some investors won't sell losing stocks. They don't want to admit they were wrong. So they stubbornly hold on, certain the stock will turn around any day. And the longer they hold the stock, the more painful it is to get out. These investors have no plan and emotion has replaced good judgment. Buy-and-hold has become buy-and-hope
.
Set a Goal and Use the 10 Rules
The first step in creating a good investment plan is deciding on an annual profit goal. For instance, an average yearly gain of 23.8 percent will double an account in three years. But to do that requires a sound plan and the discipline to follow it. With a tested plan you can have the confidence to act, instead of emotionally reacting to market swings.
Rule 1
Think like a Fundamentalist
The two most important considerations for investing are what to buy and when to buy it. Thinking like a fundamentalist is the rule which explains what to buy.
A fundamentalist looks at the financial records of a company to decide how valuable it is. But you don't need a finance degree to rate a company's value. Turner says there are only a few numbers you need to consider to find stocks worth investing in. These numbers are:
- The revenue growth rate for the current quarter versus the year-ago quarter
- The earnings growth rate of the current year versus the previous year
- The recent quarter's earnings growth rate compared to the year ago quarter
- The 5-year average earnings growth rate
- The return on equity
- The dividend yield
These fundamental factors are important because they show how fast a company is, or is not, growing. It's the anticipation of continued strong company growth, which leads to greater demand for its stock and higher stock prices.
The objective with these numbers is to find the companies with the best growth rates. To do this, first come up with a list of stocks to consider. Then put their financial data in a spreadsheet. Sort them any way you wish or use a simple scoring system.
A simple rating system could assign a number which is a company's rank for each factor. With a list of 50 stocks, the best rating would be a "50" and the company with the worst a "1". All the other companies would rate somewhere in between. Then add up the individual ratings to come up with a final score. Using this method, the companies with the highest total scores show the best overall growth.
Whatever the size of the initial list is, the goal is to end up with 10 to 20 stocks which have the best fundamentals. If you have a problem choosing between two or more closely matched stocks, Rule 2 can help you decide.
Rule 2
Spend Your Money Wisely—The Value Rule
The Value Rule is used to choose between two or more stocks with the same or similar overall fundamental rating. This rule requires the stocks to be in the same industry.
To apply the Value Rule compare the price-to-earnings ratio (PE) of the stocks with similar ratings. A company's PE can be reported in several ways. The PE may be a forecast, or the results for the last 12 months, or the most recently reported number. Turner prefers using the most recently reported PE.
The PE is the stock price cost for a dollar of a company's earnings. Stocks in the same industry with the lowest PEs have the best value for the industry group. If you have only one stock in an industry, compare its PE to the industry average to determine its relative value. For the stocks which passed the Rule 1 screening and are in the same industry, the Value Rule says pick the ones with the lowest PEs.
Rule 3
Trade like a Technician
The first two rules show what stocks to consider buying. Rule 3 explains when to buy them.
Technical analysis assumes the most important information is in the market action, not an annual report. Fundamental analysts judge the value of a company. Technical analysts judge the value of the stock. It doesn't matter how strong or weak a company is. At some point, there are no buyers to push the stock price higher or enough sellers to force it lower. Finding these points of possible price reversals is what technical analysts try to do.
With the what-to-buy decision made, the when-to-do-it decision is next. This part of the plan uses a simple trend-following system to give timely signals for buying and selling. First, take the weekly closing prices and calculate the 10-week moving average for each stock. Then shift the moving average 3 weeks into the future. On a weekly stock chart, the average calculated through the last day of this week would be plotted on the chart 3 weeks from now. The moving average represents the stock's trend.
A buy is indicated when the stock's weekly closing price moves above the 10-week moving average. A short sale (sell borrowed stock first and buy it back to exit) is signaled when the stock's price closes below the moving average. In addition, a stock is sold if it hits its stop loss price (Rule 4).
Rule 4
The Stop Loss Rule
It's important to know which stocks to buy and when, but this is only half of the story. Money is not made by buying good stocks. Money is only made by selling good stocks. Rule 4 shows how trades are closed out by using a trailing stop loss.
The stop loss price is based on the volatility of the stock. The first step is to calculate the historical volatility (HV).
HV = (52 week high - 52 week low)/[Average (52 week high - 52 week low)]
Based on its previous volatility, the expected price move (EM) for the next week can be calculated. "Stock Price" is the most recent week-ending price. "Trading Days" refers to the 5 days of the next week and the 252 days of the previous 12 months.
EM = Stock Price x HV x (√5 Trading Days/√252 Annual Trading Days)
After buying a stock, calculate the sell stop loss price. And if shorting a stock, determine the buy stop loss price. The sell stop loss for next week is this week's low price minus EM. The buy stop is this week's high price plus EM.
If the sell stop loss price is lower than the previous week's stop loss price, you use the previous stop loss. The only exception is if a dividend or stock distribution would reduce the stock price during the week. In that case, you lower the stop loss price by the amount of the dividend or distribution.
Likewise, the buy stop loss price is not raised if the next week's calculated price is higher than the previous week's stop loss price.
Rule 5
Never Marry a Stock
Love your family, love your friends, but don't love a stock. Maybe you love Apple's products or have made a lot of money from owning their stock. But that's no reason to favor the stock over any other you may consider. Following the 10 Rules will keep you from making financially damaging decisions.
For any stock you may hold now, set a price you'd be willing to sell it for. If you can't come up with a price, then it's a love affair, not an investment. Emotion is not part of a good investment plan. And as long as you stay emotionally attached to a stock, you are in financial danger, no matter how good the company may seem.
Rule 6
Follow Only "Some" Insider-Trading
There are many reasons for company insiders to sell their stock, unrelated to their opinion of its value. But insider buying may be the deciding factor when considering two closely-rated stocks.
A recent high level of insider buying is a positive factor for a stock. But by itself, this action is not a reason to buy the stock. This rule is only used to help separate those stocks which the other rules have screened.
Rule 7
Watch the Institutional Ownership
Financial institutions are required to report the stocks they own. You can use this information for stocks you're looking to buy. Since these companies are the main drivers of the stock market, it helps to know what they own and continue to buy. However, not all institutional ownership is equal. What to look for with institutional ownership is:
- If a stock has less than 5 percent institutional ownership, this is a significant negative. Consider buying the stock only if all the other factors are very strong.
- More than 95 percent institutional ownership is also a negative. As long as these financial giants hold onto the stock, there's no problem. But if one institution decides to sell, others will likely follow and the stock price could drop rapidly.
- Like Goldilocks, you want ownership which is not too much and not too little. The optimum institutional stock ownership is 30 to 60 percent.
As with insider buying, institutional ownership can be used as a stock selection tie breaker.
Rule 8
Stay Diversified
Diversification is a way to reduce investment risk. When some stocks are going down, others will be going up. Diversify stock holdings by owning stocks spread among different industry groups. The effect of a poorly performing group can be offset by the stronger performance of another group. This reduces the overall volatility of a stock portfolio which lowers the ownership risk.
Stock groups are usually classified in sectors and industries within those sectors.
- Basic Materials
- Capital Goods
- Consumer Cyclical
- Consumer Goods
- Consumer Non-Cyclical
- Financial
- Health Care
- Industrial Goods
- Service
- Technology
- Transportation
- Utilities
[NOTE: Turner says there are 11 sectors but provides a listing from the Interactive Data Corporation which is the 12 sectors shown: A more common sector listing comes from the Global Industry Classification Standard (GICS) which does have 11 sectors. These are: Communication Services, Consumer Discretionary, Consumer Staples, Energy, Financials, Health Care, Industrials, Information Technology, Materials, Real Estate, Utilities.]
Regardless of how stocks are classified, the objective is to avoid concentration in any one sector or industry.
The purpose of diversification is to balance risk by investing in multiple assets. To properly diversify it's important to limit total portfolio value invested in any one sector or industry. The sector limit is 30 percent and 20 percent for any one industry.
Rule 9
Balance Your Risk through Smart Asset Allocation
In addition to diversification, asset allocation is another way to reduce risk. This rule describes how many stocks to own and how much of each. Together, diversification and asset allocation won't prevent losses, but they will help avoid the catastrophic ones.
To answer the question of how much of each stock to own, Rule 9 says you should have an equally-weighted portfolio. An equally-weighted portfolio simply means the value (number of shares times the price of a share) of all the stocks in a portfolio, is the same. If a portfolio consisted of 10 stocks, then no one stock should have a value greater than 10 percent of the total portfolio value.
How many stocks you own is a function of how much money you have to invest. Turner says with anything less than $20,000 to invest, it's hard to make significant profits with a diversified portfolio after taking into account trade commissions.
[NOTE: This book was written before zero transaction fees became common, so this advice can be adjusted for the current market.]
The point of diversification is to limit the concentration in any one stock or group. A portfolio with only a few stocks has only limited diversification. This presents greater risk than a portfolio with a larger number of stocks. It's suggested to have at least 20 stocks in a portfolio for adequate diversification.
Asset allocation and diversification is an ongoing part of reducing risk. It's important to remember to readjust the portfolio weighting of stocks as they change in value.
Rule 10
Make a Lot More Money by Timing the Market
This rule deals with the best conditions for buying, selling, or shorting a stock. The idea is to follow the market swings up and down instead of a buy and hold strategy. Exactly how long are these swings? For Turner, it's 30 to 60 days. But in general, the simple answer is until the stock stops making an unrealized profit. Rule 10 aims to help determine where that point is.
The first timing element is a long-term chart of the Dow Jones Industrial Average. The Dow shows if the market is in a general up trend, down trend, or going sideways.
The next part of timing is to check Turner's proprietary Market Trend and Correction Forecast chart found on his website. It's a indicator of short-term market reversals.
The third chart is one you create from the Rule 3 ratings. Add up all the buy and short sell signals from the current week. Next, divide the total buy signals by the total short signals. Then classify the general market condition to come up with a Bull/Bear Rating.
| Bull/Bear Ratings | |
|---|---|
| 7-to-1 or greater | is a 5 rating |
| 5-to-1 up to 7-to-1 | is 4 |
| 3-to-1 up to 5-to-1 | is 3 |
| 2-to-1 up to 3-to-1 | is 2 |
| 1-to-1 is neutral and | is a 0 rating |
If the short signals are greater than the buy signals simply reverse the ratio and assign a negative rating. If there were 7 times or more short signals than buy signals, the rating would be -5.
The Bull/Bear Rating can be used to set stock limit orders. The table below shows what percentage of the EM to add to the most recent week's close to find the limit order price.
| Bull/Bear Rating | Limit Order EM Percentage |
| -5 | -50 |
| -4 | -40 |
| -3 | -30 |
| -2 | -20 |
| -1 | -10 |
| 0 | -5 |
| 1 to 4 | 10 |
| 5 | 20 |
The final part of stock transaction timing involves checking sector and industry charts. Turner says almost half of a stock's price action is due to its sector and industry. So when looking to buy a stock, it's best if both the industry and sector charts are moving higher. Likewise, when industry and sector charts are showing declines, look for a short sale.
Epilogue
Making the Commitment to Being a Rules-Based Investor
This book has one simple objective for the reader. It gives rules for making consistent profits in the stock market. If this is to be your recipe for investing, don't leave out any of the ingredients. Follow all the rules though bull markets, bear markets, and trendless markets.
The rules are not perfect and there will be losing trades. But applying the rules with consistency makes sure the winners will more than make up for the losers. Disciplined commitment to following a good plan will always beat reacting emotionally and having no plan.
Appendices A and B
The appendices explain stop loss orders and a detailed way of rating the Demand Fundamentals of Rule 1.
| Previous | Next |
|---|---|
 The Universal Principles of Successful Trading by Brent Penfold
The preface sets the tone for the rest of the book when it states less than 10 percent of active traders are profitable over time. But if… |
 Building Reliable Trading Systems by Keith Fitschen
There are two elements of a tradeable strategy. It has to match your risk versus reward objective and the strategy's real-time performance has to match… |
of a
Stock Operator
-
 Naked Forex by Alex Nekritin and Walter Peters
Trading off false beliefs is a sure way to lose. Each of the book's three sections covers a trading belief and shows why it's false. Alex Nekritin and Walter… -
 How I Made One Million Dollars Last Year Trading Commodities by Larry R. Williams
What does Larry Williams say is the main reason he made a million dollars in one year? His trading tools and concepts?… -
 The New Science of Technical Analysis by Thomas R. DeMark
Tom DeMark divides traders who use charts into three categories. The first type relies ongut feel
to analyze trades. This type of trader… -
 High Probability ETF Trading by Larry Connors and Cesar Alvarez
ETFs have become popular with traders for several reasons. They have lower risk compared to individual stocks, they cover all the major and…
