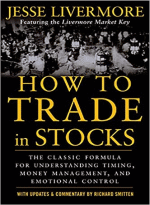
How To Trade In Stocks by Jesse L. Livermore
Preface
Jesse Livermore was known as the millionaire Boy Plunger, due to his trading skill at a young age. Livermore's first success in the stock market, made him a thousand dollars when he was only fifteen.
Edward Jerome Dies, who wrote the preface, knew and observed how the great speculators of the 20th century operated. In one of his books, Dies said Livermore could start with a small stock account and in a few months, turn it into a fortune. Dies regarded Livermore as the greatest speculator of the century.
[To account for inflation, multiply all the dollar figures in the book by 20. This will give a better picture of how big a speculator Livermore was.].
1) The Challenge of Speculation
When Jesse Livermore calls speculation a game, he makes it clear it's not child's play. You have to work, keep good records, and think for yourself. Even after 40 years, Livermore says he's still learning and applying new ideas.
Speculation anticipates future market moves, but no action is taken until the market confirms the opinion. The best trades are usually in profit immediately, so confirmation doesn't take long. Good traders have both patience and discipline. They have the patience to let profitable trades fully develop. And the discipline to exit losing trades quickly.
Losing traders do the opposite. In their eagerness to have a profitable trade, they close out winning trades too early. They add to this mistake, by holding onto losing trades in the vain hope of a recovery. Losing traders don't want to admit they made a bad trade. It's these two characteristics which separates the winners from the losers in the markets.
- Don't allow a speculation to turn into an "investment". Even the best companies can go broke. The longer you hold a stock, the more risk exposure there is.
- Never sell a stock because you think its price is too high. Instead, consider what might keep it from going higher.
- Never buy a stock simply because it had a large decline. Both time and price have to be right before you buy. In fact, Livermore would buy stocks making new highs and short those making new lows.
- Go with the trend. Don't buy on reactions or short stocks on rallies.
- Never add to a losing trade. Averaging losses is foolish.
2) When Does a Stock Act Right?
Traders only make money when they close out a position. Obviously, this makes it important to know when to exit a trade. As always, it's best to observe the market action to give you a warning sign.
A stock in an up move, usually has a pattern of higher prices on strong volume. This is followed by a pullback on lower volume. The stock keeps making new highs at a steady pace, with orderly retracements. This behavior is what Livermore refers to as "Normal Reactions".
After steady upward progress, there's an abnormal reaction. "Abnormal" simply means the stock shows unusual price movement compared to its recent past. The stock may have a flurry of volume, which sends the price both sharply higher and lower. Every advance has no follow through the next day. It's a clear change in behavior.
There are no foolproof signs of a market reversal, but you'll be right more often than not by paying attention to unusual price action. And if later market action shows you're wrong, you can get back in the market, possibly at a better price.
It's natural to dismiss unusual price activity as only temporary, and feel sure the market will quickly right itself. However, as the market continues to move against the trader, it tends to reinforce the feeling it must surely now turn around. But if you allow your emotions to argue with the market, you'll lose.
Watching market activity is not only important when you're in a trade, but also in planning your entry. You won't make money speculating every day. The best opportunities show up only about four or five times a year. By staying out of the minor day-to-day swings, you'll be more alert to the build up for a major market move.
3) Follow the Leaders
Jesse Livermore isn't shy about describing mistakes he has made. He wants these mistakes to provide a lesson for other traders. One of these expensive lessons was when he applied the actions of a few stocks to the entire stock market.
In the bull market of the twenties, Livermore saw the copper stocks rise coming to an end. Soon afterwards, the auto stocks peaked too. He saw this as a sign the rest of the stock market was open for shorting. But the overall bull market was not over, and Livermore lost a substantial amount of money.
The lesson here, is to watch only a few stocks or sectors, and not apply their action to the rest of the market. Follow only the active stocks, the market leaders. It becomes confusing to try to study more than a few stocks or groups. If you can successfully analyze two stocks from four major sectors, that's all you need.
4) Money in the Hand
Successful speculation is a business. Its life blood is the speculator's capital. No money, no business. This makes limiting the risk to a trading account essential. A simple risk reduction method is to set a fixed limit of how much is risked on each trade.
Money that comes too easily often leaves just as quickly. A speculator who makes a large profit in a couple of months, is easily overcome by greed. In search of a quick fortune, this speculator starts taking greater risks and soon goes bust. No business CEO expects to get rich overnight, neither should a speculator.
If you don't risk it, you can't lose it. After every profitable trade, take half out and put it in the bank. It's beneficial for some of the withdrawal to be in cash. Doing so makes the money feel more real, instead of just a number in an account.
Whenever your account has doubled, it's a good idea to set aside half of the profit as a reserve. Planned withdrawals like these, are a good insurance policy against greed causing over-trading.
5) The Pivotal Point
A stock price high or low which is not exceeded for a period of time, is a Pivotal Point. A typical example would be a stock which makes a low at $40, after a long-term down trend. It next rallies over a few days up to $45, then goes sideways between $45 and $40 for a week. One day it starts going higher until it reaches $49. Then once again goes sideways for a few days. Next the stock suddenly drops 3 or 4 dollars and gradually moves down close to $40.
This is the moment of truth for the stock. The low at $40 is a Pivotal Point. If the stock is to resume its down trend, it should drop below $40 by 3 dollars or more.
If it holds above $37 ($40 - $3) it can be bought when it rallies $3 off its low. If price goes below $40 but not $37, then the stock can be bought if it reaches $3 above the $40 Pivotal Point. An up trend is confirmed if prices then exceed the high Pivotal Point of $49 by 3 dollars.
Livermore doesn't use the terms, "bullish", or "bearish" when referring to market trends. He considers bull and bear markets yearly trends which contain shorter contrary trends. Livermore trades these shorter trends and calls them "Upward Trends" and "Downward Trends". This makes it acceptable to be short in a intermediate down trend, within a long-term up trend.
Over time, Jesse Livermore saw there were natural Pivotal Points at various levels, like $50, $100, and $200. If a stock when through one of these price points, it was likely headed higher. He also learned it was important to be alert to signs a stock was hesitating, after breaking through a Pivotal Point. If a stock doesn't make a strong continuation move after going through a Pivotal Point, exit the trade.
6) The Million Dollar Blunder
In contrast to the advice you should never average a loss, you should average a profitable trade. Whether long or short, you accumulate a position with multiple orders.
If you wanted to buy 300 shares, you'd first start with 100. When those shares were in profit, you'd add another 100. Then when those were also showing a profit, add the final 100 shares. Each entry should also include an appropriate exit point, if the trade starts to show a loss.
The "Million Dollar Blunder" happened when Livermore was strongly bullish on Cotton. He placed a buy order, which was large enough to move the market higher. But prices soon dropped back down and he ended up selling at a loss of $30,000.
But his opinion of Cotton didn't change. A few days later he again bought a large position. And again the market reacted in the same way giving him another large loss.
Jesse Livermore was persistent. Over the next six weeks he repeated his purchases, with losses of $25,000 to $30,000 each time. In total, Livermore lost almost $200,000. To eliminate further temptation, he had the Cotton ticker tape machine removed from his office.
Two days later, Cotton started on a run which eventually topped out at 500 points higher. If Livermore had put on the same position as before, he would have made a million dollars.
The cause for this fiasco was impatience. Livermore was sure Cotton would make a big move, if it went 12½ cents from its current price. He simply didn't want to wait for that move to happen. Instead, he reacted with frustration with Cotton for his loss. But later, Livermore realized he was wrong to jump the gun on a good plan, and then to take out his anger at the market. When wrong, admit it and move on.
The market always shows you when you're wrong, by delivering losses. But Livermore sometimes didn't wait for market action, but instead listened to his subconscious. He would suddenly feel uneasy about a position he held, even though there was no apparent reason. While he preferred acting on the basis of his records, his inner voice had proved worth listening to a number of times. Livermore felt this unconscious alert, was a product of all the years he spent studying the markets with the rigor of a scientist.
Serious traders keep good records. A simple trading notebook is all that's needed to start. Record any useful information you come across, market observations, or trading thoughts you have. On the first page it's suggested you write, Beware of inside information…all inside information.
Success in the marketplace takes work, it won't be handed to you.
7) The Three Million Dollar Profit
Impatience caused Jesse Livermore to lose $200,000 in Cotton, then miss out on a possible profit of $1,000,000. However, that was the exception. By following his rules, he made $3,000,000 in a series of grain market trades.
At a time when Livermore held a large long position in Wheat, he noticed the Rye market usually led the Wheat higher. But one day, Rye stopped being the leader and Livermore wanted to know why.
He thought another speculator had stopped buying Rye in order to support a Wheat position. So Livermore tested the strength of the Rye market by placing three sell orders for 200,000 bushels. The market absorbed the first two, but not the third, and the price dropped.
This price action made Livermore think Wheat was also lacking support. He sold 5,000,000 bushels of Wheat at the market. And the price dropped through a Pivotal Point. He was convinced he was right in his assessment. So he continued shorting Wheat as it went lower. In the end, Livermore made a total profit on his trades of over $3,000,000.
8) The Livermore Market Key
After many years of speculation, Jesse Livermore came to the conclusion nothing new happened in the stock market. There were variations, but the same price patterns kept repeating. It became his goal to find out what were the normal market swings in any trend, and what signaled a reversal of the trend. Through careful record keeping, he defined what he called, "Natural Reactions" and "Natural Rallies".
The form Livermore used to record stock prices, he named the "Map for Anticipating Future Movements." This was a journal of pages with nineteen columns. Each column contained either the rally, reaction, or trend prices.
For stocks selling about $30 or higher, Livermore determined a Natural Rally or Natural Reaction was about 6 points. Since a single stock can act contrary to other stocks in the same group, he combined the price of two stocks to form his "Key Price". It's this price which determines the trend.
9) Explanatory Rules
Livermore's trading method is based on monitoring counter-trend moves. A "Natural Rally" or "Natural Reaction" of about 6 points is normal, and the trend is expected to continue. But if price exceeds a "Pivotal Point", a swing high or low, by 3 points or more, it's likely the trend has reversed.
To record stock prices, a sheet of paper with nineteen columns is needed. The first column is for the date and the other columns are labeled with the repeated series, "Secondary Rally", "Natural Rally", "Upward Trend", "Downward Trend", "Natural Reaction", and "Secondary Reaction".
The first two sets of figures are for two stocks from the same group. The last set of figures is for the "Key Price", the combined price of the two stocks. Use black ink to record Upward Trend prices, red ink for Downward Trend prices, and pencil for the rest.
Assume a stock is moving higher and prices have been recorded in the Upward Trend column. Draw a red line under the last Upward Trend price when there's a move down of about 6 points or more. This is a Natural Reaction. Record the downward prices in the Natural Reaction column.
Each day, continue to record new lower prices in the Natural Reaction column. Draw a red line under the last Natural Reaction price when there's a new up move of about 6 points or more.
The two underlined prices are Pivotal Points. If the new up move exceeds the Pivotal Point high by 3 or more points, then prices are recorded in the Upward Trend column. Otherwise, these new prices go in the Natural Rally column.
This same type of process is followed for a down trend. Draw a black line under the last price in the Downward Trend column, when there's an up move of about 6 or more points. These up move prices are recorded in the Natural Rally column.
When there's another down move of 6 points or more following the rally, a black line is drawn under the last Natural Rally price.
As before, there are now two Pivotal Points. The most recent low in the Downward Trend column is one. And the most recent high in the Natural Rally column is the other.
The red and black underlined prices identify the Pivotal Points. And it's the Pivotal Points which define the trend. When a rally or a reaction exceeds a Pivotal Point by 3 or more points, it indicates a trend. At that time, prices which were recorded in the Natural Rally column, switch to the Upward Trend column. And prices which were getting written in the Natural Reaction column, change to the Downward Trend column.
When a 6 or more point rally happens off of a Natural Reaction, the prices are recorded in the Natural Rally column, only if the move exceeds the previous Natural Rally high. Otherwise, the rally prices are put in the Secondary Rally column.
The same holds true for reactions coming off a Natural Rally. Only if the reaction prices exceed the most recent Natural Reaction low, are they put in the Natural Reaction column. If the low is not exceeded, the prices go in the Secondary Reaction column.
The Key Price is recorded in the same way as the individual stocks. The only exception is how the rally and reaction moves are determined. Since the Key Price combines two stock prices, rallies and reactions are determined by moves of about 12 points instead of 6.
Each time price goes from a trend column to a rally or reaction column, the last trend price is a Pivotal Point. The same applies for the last rally or reaction price when switching back to a trend column. Future market action near these swing highs and lows will indicate if the trend will continue or reverse.
The sign a trend will continue is when a previous trend Pivotal Point is exceeded by 3 points for a stock, or 6 points for a Key Price. If price approaches but fails to exceed this Pivotal Point and instead reverses by 3 or more points (6 for the Key Price), it indicates a trend reversal. These 3 point moves in relation to the Pivotal Points are the key indicator for trend continuation or reversal.
The essence of Livermore's Market Key is the division of price moves into three levels. The smallest moves are the Secondary Rally and Secondary Reaction swings. The next larger swings are the Natural Rally and Natural Reaction. And the Upward Trend and Downward Trend identify the largest swings. The swing level changes only if a Pivotal Point is exceeded. And if prices fall short of a Pivotal Point, the swing level remains the same.
Charts and Explanations
Jesse Livermore didn't use conventional stock charts and the "charts" in this section refer to some filled-out examples of his price recording sheets.
| Previous | Next |
|---|---|
 Street Smarts by Laurence A. Connors and Linda Bradford Raschke
The trades in this book follow a single principle that the setups and entries must have minimum risk to keep losses small. Risk reduction… |
 A Guide to Creating a Successful Algorithmic Trading Strategy by Perry J. Kaufman
When Perry Kaufman first started using automated systems in the 1970s, he was very much in the minority. But today, algorithmic… |
of a
Stock Operator
-
 Naked Forex by Alex Nekritin and Walter Peters
Trading off false beliefs is a sure way to lose. Each of the book's three sections covers a trading belief and shows why it's false. Alex Nekritin and Walter… -
 How I Made One Million Dollars Last Year Trading Commodities by Larry R. Williams
What does Larry Williams say is the main reason he made a million dollars in one year? His trading tools and concepts?… -
 The New Science of Technical Analysis by Thomas R. DeMark
Tom DeMark divides traders who use charts into three categories. The first type relies ongut feel
to analyze trades. This type of trader… -
 High Probability ETF Trading by Larry Connors and Cesar Alvarez
ETFs have become popular with traders for several reasons. They have lower risk compared to individual stocks, they cover all the major and…
