Street Smarts by Laurence A. Connors and Linda Bradford Raschke
Preface
1) Introduction
2) Swing Trading
3) Money Management
Part One
Tests
4) Turtle Soup
5) Turtle Soup Plus One
6) 80-20's
7) Momentum Pinball
8) 2-Period ROC
Part Two
Retracements
9) The "Anti"
10) The Holy Grail
11) ADX Gapper
Part Three
Climax Patterns
12) Whiplash
13) Three-Day Unfilled Gap Reversals
14) A Picture's Worth A Thousand Words
15) Wolfe Waves
16) News
17) Morning News Reversals
18) Big Picture News Reversals
Part Four
Breakout Mode
19) Range Contraction
20) Historical Volatility Meets Toby Crabel
Part Five
Market Musings
21) Smart Money Indicators
22) More Words On Trade Management
23) Be Prepared!
24) Final Thoughts
25) The Secrets Of Successful Trading
Appendix
Preface
The trade setups and entries in this book follow the single principle of minimizing risk, to keep losses small. Risk reduction in trading starts with limiting losses, either in size or number, preferably both. Keeping losses small ensures the profits will more than make up for them.
1) Introduction
The strategies in this book are short-term swing trades. The trade setups aim to identify areas of support and resistance for the entries and exits. Although the authors have been using these strategies for 15 years, they advise:
- Paper trade until you gain confidence in the strategy. If you don't have confidence in the trade pattern, don't trade it.
- Start with only one pattern. It may be all you need to do well.
- Let the patterns guide your actions, not an opinion of which way the market is headed.
- Although the setups are precise, they are not to be applied mechanically.
- All the strategies include an initial stop loss, usually a small one. Always using a stop loss is critical to your long-term success.
2) Swing Trading
The setups in this book are swing trades. These trades follow short-term price moves, both with and against the major trend.
It's the strength or weakness of the economy which creates long-term major trends. But instead of the economy, swing trading relies on recognizing support and resistance areas to project probable moves. For the authors, the main goal of each trade is not to maximize profits, but to minimize risk.
Swing trading relies on active liquid markets and works off of price extremes. There are three basic types of swing trades:
Tests of highs and lows
Previous price highs and lows define levels of resistance and support. When prices approach one of these extremes, it offers a potential good entry point with a low risk stop loss.
Trend reactions
Another basic swing trade takes advantage of a major trend reaction. Once the major trend resumes, The trade is entered and the stop loss is placed outside of the reaction high or low.
Price climax or exhaustion
This trade anticipates a trend reversal in a volatile market and enters when prices have reversed. The reversal point defines the stop lost location.
Along with understanding these basic patterns, there are foundational trading rules to follow:
- Enter and exit trades using the prices from only one time frame.
- A trade should be profitable shortly after entry. If prices stall, exit the trade and don't wait to get stopped out.
- Don't carry a loss overnight. If the trade still looks good, try again the next day at a better price.
- Take windfall profits. When a trade is much more profitable than expected, take at least half of the profits. Often most of a month's profit comes from only a few big trades, so make sure to grab them when they occur. If you keep a part of your original position, protect it with a very tight stop.
3) Money Management
The basis for sound money management is minimizing losses and drawdowns while maximizing profit opportunities. By their nature, short-term trades don't make large per-trade profits. This is why losses must be kept small to avoid large drawdowns.
To keep the losses small, always use an initial stop to exit the entire position. Place the stop 1 or 2 ticks above the most recent high or below the most recent low. You can take profits by scaling out of your position, but always put on your entire position at the entry.
If a trade moves sharply in your favor, or if a price bar has an unusually large range, exit the position. The market is likely at a reversal point. Market extremes are created by emotions, which makes it easy to get caught up in an emotional reaction.
Instead of being pleased with their profit, some traders think how much more they could have made with a larger position. Take those thoughts as a warning. Accept the profit and get out of the trade.
Tests
4) Turtle Soup
Many traders like to buy or sell when price exceeds a previous high or low. These breakout traders act on the expectation prices will continue in the same direction. But if prices should reverse shortly after the breakout, the extent of the reverse move can be significant. That's the basis for the Turtle Soup strategy. For this pattern and all other trade strategies, only the day session prices are used and the night session is ignored.
- During today, price sets a new 20-day low (exceeds the lows of the previous 19 days). The previous 20-day low must have been at least 4 days prior to today (this is very important).
- As soon as the prior 20-day low is exceeded, place a buy stop order (good for today only) 5 to 10 ticks above the prior 20-day low.
- When the buy order is filled, enter a good-till-canceled sell stop-loss 1 tick below today's low.
- This trade will last from a few hours to a few days depending on market volatility. It's important to protect your profit with a trailing stop. Generally the more profit you have, the tighter the stop should be.
- If stopped out in the first two days (entry day and the next) of the trade, you may re-enter on a buy stop at the original entry price. Taking this second trade slightly increases profitability.
5) Turtle Soup Plus One
This trade takes advantage of false breakouts like Turtle Soup. It uses the same type of setup, only the entry is one day later.
- Yesterday the low was a new 20-day low and the close was at or below the previous 20-day low. The previous 20-day low must have been at least 3 days before yesterday.
- Today, enter a buy stop order (good for today only) at the previous 20-day low.
- As soon as the buy order is filled, place a stop-loss order 1 tick below the lower low of today and yesterday.
- Take partial profits within 2 to 6 days. Use a trailing stop for the remaining position.
Both Turtle Soup and Turtle Soup Plus One can be traded on shorter and longer time frames using the same basic rules. For intraday trades, the entry stop is 1 tick above the previous 20-bar low and 1 tick below the previous 20-bar high.
6) 80-20's
This is a day-trading strategy which was derived from George Taylor's trading method and research done by Steve Moore.
Moore tested what happened when a market closed in the upper or lower 10 percent of its daily range. 80 to 90 percent of these cases continued in the same higher or lower direction the next day. Yet 50 percent of the time, prices reversed during the day to close in the opposite direction.
- Yesterday's open was in the upper 20 percent of the day's range and the close was in the lower 20 percent of the day's range.
- Today, if price drops below yesterday's low by about 5 to 15 ticks (use your discretion), place a buy-stop order at yesterday's low.
- Immediately after getting the buy order filled, enter a stop-loss order near today's low.
- During today, move the stop up to lock in profit. This pattern is not an indicator of long-term direction, so if not stopped out, usually it's best to get out at the close.
7) Momentum Pinball
George Taylor's trading method defined each 3 day sequence as a "buy day", "sell day", and a "sell short day". However, depending on the day's price action, he would sometimes sell short on what was supposed to be a buy day. The Momentum Pinball offers a simple way to decide if you should buy or short the following day.
- Create the LBR/RSI indicator. This indicator consists of a 3 period Relative Strength Index (Welles Wilder's RSI) of the daily rate of change (yesterday's close subtracted from today's close).
- A LBR/RSI reading under 30 (over 70 when shorting) yesterday, sets up today for buying.
- Today, enter a buy stop order above the first hour's high price.
- When your order is filled, enter a sell stop at the first hour's low.
- It's rare for this trade to get stopped out, but when it happens, it's profitable to re-enter at the original entry price.
- Carry profitable trades overnight and exit on higher prices, no later than the close. Taylor had a price target of "just above" today's high for his exit price.
8) 2-Period ROC
This trade is similar to Momentum Pinball except the rate of change is 2 days instead of 1 day. It also follows the basic Taylor Trading Method of a day for buying followed two days later by a day for selling short.
This trade setup follows a 1 to 3 day sell off for a buy or 1 to 3 day rally for a short. The pattern for a buy day is an open on the day's low and a close on its high. The formation of the low is a test of the support area of the previous day's low. If the buy day's low forms slightly above or below the previous day's low, the lower of the two lows is the stop loss.
Similarly, a sell short day should have the high on the open and be a test of the previous day's high. If the test is successful, the higher of the two highs is the price level for the stop loss.
The 2-period rate of change provides an entry point price. First, subtract today's close from the close two days prior. Then add this number to yesterday's close. If tomorrow's close is above this price, enter, or continue to hold, a long position on the close. If tomorrow's close is below this price, take a short position, or continue to hold an existing short.
Retracements
9) The "Anti"
This trade is a basic swing reaction pattern with a unique way to define the long-term trend. It uses the slope of the %D line from the stochastic indicator to show the trend's momentum. Since momentum tends to lead price reversals, it's an early indicator of price change. The stochastic is set up with a 7-period %K ("fast" line) and a 10-period %D ("slow" line). Use 4 for the %K smoothing parameter.
"Anti" represents a basic principle of price action and can be traded in all time frames.
- The %D should show a definite up-trend.
- %K was moving higher above %D, but a price retracement causes %K to turn back towards %D.
- The trade is entered when %K again turns up.
- One way to enter is to wait for the two lines to form opposing slopes for at least 3 days. Place a buy stop order 1 tick above the previous bar's high. If the stop is not hit, trail it down with each new previous bar's high.
- A second entry method is to use a trend line drawn across the retracement pattern. Buy on a break of the trend line.
- Place the initial stop under the entry bar. As with all swing trades, this should quickly be profitable, but if stopped out, re-enter at a better price.
- Look to exit profitable trades within 4 bars on a price climax.
10) The Holy Grail
Of course the title is not meant to be serious. Instead of a grail, holy or otherwise, the pattern uses Welles Wilder's Average Directional Index (ADX). It identifies an entry point to buy or sell the first retracement of a new strong trend.
- A strong trend is indicated by a rising 14-period ADX and a value above 30 (same for shorting).
- Wait for price to retrace and touch a 20-period exponential moving average. When it touches the moving average, place a buy stop above the previous bar's high. Usually the ADX will turn down at the same time.
- When the buy stop is filled, enter an initial sell stop, at the swing low just formed. Move the sell stop up as price advances and exit at least part of the position at the last swing high. If you decide to hold part of your position at the high, keep close stops on the remaining position.
- If stopped out by the initial sell stop, re-enter on a buy stop at the original entry price.
- Following a profitable trade, wait for the pattern to repeat before making a new trade. The ADX must again rise above 30 and the price retrace to the 20-period exponential moving average.
11) ADX Gapper
This is a gap-reversal pattern. It relies on the Average Directional Index (ADX) and the Plus and Minus Directional Indicators (+DI/-DI) as trade filters. The ADX shows trend strength and the +DI/-DI identify the trend direction. The strategy waits for a gap opposite the trend direction and enters when the trend resumes.
- The 12-period ADX is greater than 30 (same for shorts).
- A 28-period +DI/-DI is used to determine trade direction. The +DI must be greater than the -DI.
- Today's open must gap below yesterday's low.
- Place a buy stop in the area of yesterday's low.
- When a buy order is filled, put a sell stop at today's low.
- Maintain a trailing stop throughout the day. If not already stopped out and the close is strong, hold the trade overnight.
Climax Patterns
12) Whiplash
This pattern waits for a morning price gap followed by an afternoon reversal. Usually the reversal carries through the next morning and sometimes the following few days.
- Today the market opens below yesterday's low.
- Buy on the close (MOC) if it's higher than the open and in the top half of the day's range.
- If the open tomorrow is below today's close, exit the position and accept the loss.
- If tomorrow opens above today's close, maintain a trailing stop to retain the profit. As with the other strategies, where you place a trailing stop relies on your judgment. The main consideration is to not let a profitable trade turn into a loss.
13) Three-Day Unfilled Gap Reversals
This pattern relies on a gap reversal which starts to get filled within 3 days.
- Today, the market gaps open below yesterday's low and the gap is not filled.
- After the close, place a buy stop 1 tick above today's high and maintain the stop for the next 3 days. If not filled within 3 days, cancel the order.
- When the buy stop is filled, put an initial sell stop at the low of the gap-down day.
- Often price will fill the gap and then reverse, so it's important to guard your profit with a trailing stop.
14) A Picture's Worth A Thousand Words
This is a group of three climax-reversal patterns. Since recognition of the patterns is subjective, there are no rules. However, the patterns do provide distinct points for stop placement to control risk. As with the other strategies, if a trade is going to be profitable, it happens quickly. Since reversals can also happen quickly, using a trailing stop is always important.
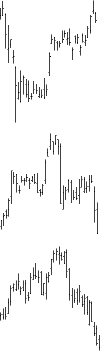
The first pattern is the "Spike and Ledge". This pattern forms at both tops and bottoms. Price has a climatic move to create the spike. Then there's a retracement and sideways action to form the ledge. Enter when price breaks out of the ledge and place a stop on the opposite side of the ledge.
"Fakeout-Shakeout" is the next chart formation and it works for both tops and bottoms. When price breaks out of a ledge (rectangle) or triangle pattern, it normally should not retrace back to the breakout point. The "fakeout" is a false breakout and this is the setup for the "Fakeout-Shakeout". Enter once price retraces back through the breakout point. The initial stop is placed at the most recent swing low when buying or swing high when shorting. Move the initial stop to breakeven shortly after entry and follow up with a trailing stop.
The third pattern is "Three Little Indians". If prices climax with three symmetrical peaks or valleys, this forms the "Three Little Indians" pattern. This formation holds for both top and bottom reversals. No specific entry point is specified, only that price is reversing. The book's charts indicate with a top reversal you short on breaking a minor swing low or about a 50 percent retracement of the swing to the third high. The initial stop goes above the third peak and should be moved to breakeven quickly. As with the other patterns, use a trailing stop to protect your profits.
15) Wolfe Waves
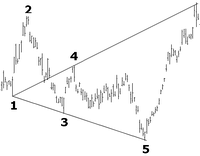
Wolfe waves are based on the idea, market price action produces an equal reaction. The method projects both entry and profit target points. The pattern is formed from 4 alternating swing reversal points. To identify the pattern, start with a swing high for a buy setup, or a swing low, for a short setup. This first swing high or low, is identified as point number 2. Number 3 marks the swing point after 2, and is a low if 2 was a high, or a high, if 2 was a low. Number 1 is the opposing swing reversal point before point 2. Point 3 must be lower than point 1 for a buy and higher for a short. Number 4 is the swing point following point 3. Point 4 should be higher than point 1 when buying and lower if shorting.
Draw a trend line from point 1 to point 3. Its extension projects the future entry area at labeled number 5. No specific method of entry is given, but look to enter on an indication price is reversing off the trend line projection. When price does reverse at point 5, that's where to put the initial stop. To find the profit target, draw a trend line from point 1 through point 4, and extend it to the right. The target price is this trend line.
16) News
If listening to the news told you which way a market would go, trading would be very simple. If the news is bad, you sell. If the news is good, you buy. But markets are not that simple.
Instead of listening to the talking heads chatter, listen to what the markets are saying. If a company issues a poor earnings report, it's common sense the stock should go lower and often it does. But if the dip is only momentary, the market is saying it's ignoring the report and it's likely the stock is headed higher. Chapters 17 and 18 offer specific strategies to profit from news.
17) Morning News Reversals
Where there's volatility and uncertainty, there's an opportunity for profit. Morning news reports often provide that opportunity.
- Today there's a significant government report which comes out at 8:30 EST.
- Find the bond market high and low for the previous trading day.
- Note the immediate reaction of the bond market to the report. If the bond market goes up at least 4 ticks above the prior day's high, place a sell-stop 1 to 3 ticks below the prior day's high. If instead, the bond market reacts by dropping at least 4 ticks below the previous day's low, place a buy-stop 1 to 3 ticks above the previous day's low.
- When the order is filled, place an initial stop 1 tick above today's high if shorting, or 1 tick below today's low if buying. As soon as the position is profitable, move the stop to breakeven.
This strategy can also be applied to currencies using different setup values. Look for a reaction to the report of 10 to 20 ticks beyond the prior trading day's high or low. The entry stop is placed 5 to 10 ticks inside of the prior day's high or low. Move the stop to breakeven when the trade is in profit.
18) Big Picture News Reversals
This is a news situation which doesn't happen every day, but when it does, the trade may last for many weeks.
- A major negative event impacts a market.
- Make note of the last closing price prior to the news of the event.
- Place a standing buy-stop at the closing price just found. If the market can't recover from the event, it should not come back to that price. But if it does, the market is strong and can move significantly higher.
- Once buy-stop stop is hit, place the initial sell-stop at the lowest level the market reached after news of the event came out.
Breakout Mode
19) Range Contraction
Swing trading relies on prices consistently moving up and down. But sometimes, prices continues to move in one direction with only a few minor reactions. When a market opens at one end of the day's range and closes at the opposite end, this is considered a trend day. Trying to swing trade during a trend day is a losing approach. This makes it important to identify trend days before they occur.
The first way to spot when a trend day will occur, is with a pattern called ID/NR4. A day with the smallest daily price range compared to the previous 3 days is NR4. ID refers to an inside day which has a lower high and a higher low than the previous day's range. The ID/NR4 indicates a trend day, but not the direction.
- Yesterday was an ID/NR4.
- Today, place both a buy-stop 1 tick above yesterday's high and a sell-stop 1 tick below yesterday's low. These stop orders are good for today only.
- If the buy-stop is filled, put another sell-stop order at 1 tick below yesterday's low. If the buy-side trade is stopped out, the second stop automatically puts on a short trade. And if the sell-stop was filled first, then add another buy-stop 1 tick above yesterday's high.
- Put on a trailing stop when in profit.
- If the trade is going to be profitable, it usually does so immediately. So if within 2 days, the trade isn't in profit, exit the position at the market on the close (MOC).
20) Historical Volatility Meets Toby Crabel
Historical volatility (formula is in the Appendix) is a measure of how dynamic a market's prices are. Volatility is more cyclical and trending compared to prices. If you can predict when volatility will increase, you can take advantage of strong moves.
This strategy looks for the point when low volatility is likely to increase and start trending higher.
- An indicator of low volatility is the ratio of the 6-day historical volatility divided by the 100-day historical volatility. This ratio's value should be less than 0.50 (50 percent).
- When this ratio level is met, there needs to be either an inside day or a NR4 day (explained in chapter 19).
- At this point, yesterday was either an inside day or a NR4 day and the historical volatility ratio was less than 50 percent. Today, put a buy-stop 1 tick above yesterday's high, and a sell-stop 1 tick below yesterday's low.
- If the buy-stop is filled first, immediately put on an additional sell-stop 1 tick below yesterday's low. This automatically puts on a short trade if the buy trade is stopped out. If it's the sell-stop hit first, put on another buy-stop 1 tick above yesterday's high so the trade position is reversed if the short trade is a loss. These additional stops are for today only. Add a trailing stop once the trade is in profit.
Market Musings
21) Smart Money Indicators
Described here are some indicators which can provide a general evaluation of the market. Specific guidelines are given, but none of these tools should be acted on alone.
Smart Money Index
This indicator is designed to show the actions of the uninformed public and the knowledgeable professionals. The index measures the net change in the first hour of the Dow compared to the Dow's net change during the last hour of the day. The Smart Money Index is constructed with the following three steps:
- Determine the point change in the Dow from yesterday's close to the end of today's first hour. That number is either positive or negative. Multiply the net change by -1.
- Add the net Dow point change during the last trading hour to the morning's number in rule 1.
- Record the daily sum from rule 2. If the total is greater than 20, look for market buying opportunities the next day. When the sum is less than 20, look to be selling short the next day.
Tick Indicator
This indicator is used exclusively for trading the S&P futures. The tick is the difference between all the NYSE stocks on up ticks and all those on down ticks. Look for divergence between price and this indicator.
- The ticks should be less than -350 as the S&P makes an early day low.
- Next the S&P must equal or go below the morning low at least 90 minutes later. At the same time, the tick should make a low higher than its earlier low by at least 5 ticks. Then if the ticks improve off the second low by 100 ticks, enter at-the-market. The initial stop is placed at the day's low.
- Protect profit with a trailing stop. It's suggested to keep moving the stop so it always secures half the existing profit.
- If profitable at the close, the position may be held over-night and exited on the next morning's continuation.
Watch for extreme tick readings. With a tick greater than 400, look to short the next day's morning rally. When the tick is lower than -400, expect a next day morning pull-back as an opportunity to buy.
Arms Index
This indicator combines two ratios. The first divides the daily number of advancing stocks by the number of declining stocks. This ratio is then divided by the result of the volume of stocks moving higher divided by the volume of stocks going lower. Using a 5-day moving average, a value of 1.20 indicates a possible bottom and if less than 0.80, a possible top. As with all indicators, the Arms Index is best used in confirmation with other indicators or patterns.
22) More Words On Trade Management
Beginning traders should paper trade until they can show a break even or better record. Short-term trading yields small profits, but also small losses. In time, the losses will become even smaller and fewer, with an occasional large profit.
Expect that much of the time you won't have a clear understanding of what is happening in a market. It's best to only concentrate on a few reliable strategies. And pay attention to what a market does in response to news or how minor corrections show a trend's strength.
Beware of having a strong opinion about where a market is headed. A strong opinion about market direction can lead to fighting the market, if proven wrong. Instead, when a trade goes against you, let your stop get you out. Holding a losing trade overnight will only make losses worse. At the same time, not only take losses quickly, but also any well-above-average profits.
Overall, keep your trading process simple and be consistent in your approach.
23) Be Prepared!
Swing trading requires planning to act logically instead of reacting emotionally. To plan effectively, have a nightly routine to prepare for the next day. Part of the plan should include keeping a record of all trades. Every so often review the records to see what you did right and what you did wrong. Find the plan which works best and apply it with consistent discipline.
24) Final Thoughts
The aim of this book is to provide concise strategies to give a trading edge over the uninformed trader. Part of the trading edge is using stops to control losses. The final chapter, written by Fernando Diz, a Syracuse University finance professor, explains why sound money management is so important to trading success.
25) The Secrets Of Successful Trading
The three most important elements required for successful trading are psychological balance, a trading edge, and strict money management. A study was done of 925 Commodity Trading Advisor (CTA) programs from 1974 through 1995.
Success was defined simply as the ability to stay in business. 490 CTAs survived and 435 went out of business. A number of statistical measures were used on the winning and losing CTAs to find the difference in their results. The conclusion was simple. While the losing CTAs had a smaller edge than the winners, it was still large enough to stay in business. What caused them to fail, was poor money management.
Appendix
The extensive appendices include the steps needed to calculate historical volatility, 20 tables of the Moore Research Center's market reactions for certain situations, trade worksheets, and sources for research services, trading software, and charting services.
Connors or Raschke own the trademark on the following trade names: Turtle Soup, Turtle Soup plus One, 80-20's, Momentum Pinball, LBR/RSI, and Anti.
Special Report
Advance/Decline Market Buster
The stock exchange daily advances and declines give a good indication of the overall market strength. This strategy uses this relationship to trade the S&P 500 futures.
- Calculate a 3-day average of the advances minus the declines for the NYSE and use the value for a 3-period Relative Strength Index (RSI).
- An RSI reading of 70 or more indicates the stock market is overbought and if 30 or below, it's oversold.
- A sell signal is given if the market (S&P 500 futures) is below its 100-day exponential moving average and the RSI drops less than 40 points from above 70 to below it.
- A buy signal is given if the market is above its 100-day exponential moving average and the RSI moves less than 40 points from below 30 to above it.
- The stop is 2 percent and close out the trade in 3 days.
The 40 point RSI limit helps eliminate the possibility of market exhaustion which would stop continuation of the move. It's cautioned not to trade this mechanically, but to use it with other confirming factors.
| Previous | Next |
|---|---|
 New Concepts in Technical Trading Systems by J. Welles Wilder
Before the personal computer became a household fixture, there were programmable calculators. These calculators could carry out a set of simple… |
 How To Trade In Stocks by Jesse L. Livermore
Jesse Livermore was known as the millionaire Boy Plunger due to his trading skill at a young age. Livermore's first success in the stock market made him a… |
of a
Stock Operator
-
 Naked Forex by Alex Nekritin and Walter Peters
Trading off false beliefs is a sure way to lose. Each of the book's three sections covers a trading belief and shows why it's false. Alex Nekritin and Walter… -
 How I Made One Million Dollars Last Year Trading Commodities by Larry R. Williams
What does Larry Williams say is the main reason he made a million dollars in one year? His trading tools and concepts?… -
 The New Science of Technical Analysis by Thomas R. DeMark
Tom DeMark divides traders who use charts into three categories. The first type relies ongut feel
to analyze trades. This type of trader… -
 High Probability ETF Trading by Larry Connors and Cesar Alvarez
ETFs have become popular with traders for several reasons. They have lower risk compared to individual stocks, they cover all the major and…